Monitoring
Monitoring of Redis standalone and cluster setup using Prometheus
Collecting Redis Instance Metrics (redis-exporter)
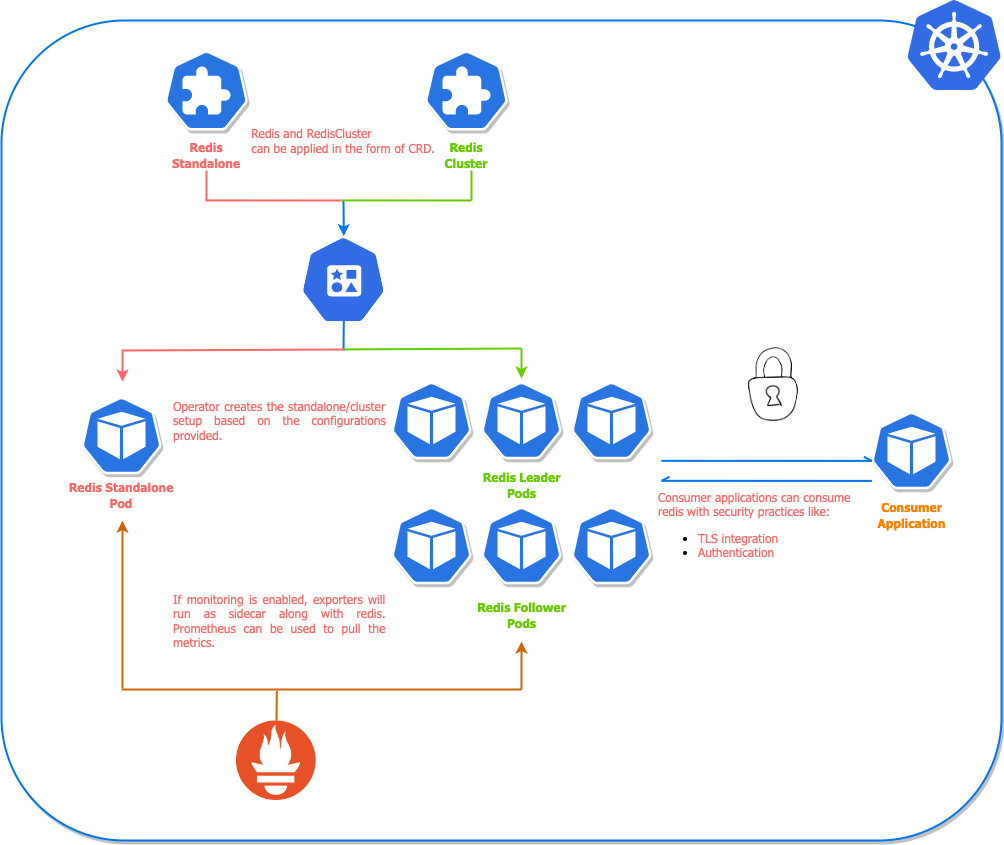
The redis-operator uses redis-exporter to expose metrics of redis setup in Prometheus format. This exporter captures metrics for both redis standalone and cluster setup.
The monitoring architecture is illustrated in the diagram:
For the helm chart installation of redis setup, we can simply enable the redis exporter by creating a custom values file for helm chart. The content of the values file will look like this:
redisExporter:
  enabled: true
  image: quay.io/opstree/redis-exporter:1.0
  imagePullPolicy: Always
When we have defined the redis-exporter related config in values file, we can apply or upgrade the redis setup. We need to pass the created file as an argument to the helm command.
Enabling monitoring for standalone setup:
$ helm upgrade redis ot-helm/redis -f monitoring-values.yaml \
  --install --namespace ot-operators
Enabling monitoring for cluster setup:
$ helm upgrade redis-cluster ot-helm/redis-cluster -f monitoring-values.yaml \
  --set redisCluster.clusterSize=3 --install --namespace ot-operators
ServiceMonitor
Once the exporter is configured, we may have to update Prometheus to monitor this endpoint. For Prometheus Operator, we have to create a CRD based object called ServiceMonitor. We can apply the CRD definition as well using the helm command.
serviceMonitor:
  enabled: false
  interval: 30s
  scrapeTimeout: 10s
  namespace: monitoring
For kubectl related configuration, we may have to create ServiceMonitor definition in a YAML manifest and apply it using kubectl command.
ServiceMonitor for Redis cluster setup:
---
apiVersion: monitoring.coreos.com/v1
kind: ServiceMonitor
metadata:
  name: redis-cluster
  labels:
    redis-operator: "true"
    env: production
spec:
  selector:
    matchLabels:
      redis_setup_type: cluster
  endpoints:
  - port: redis-exporter
    interval: 30s
    scrapeTimeout: 10s
  namespaceSelector:
    matchNames:
    - monitoring
ServiceMonitor for Redis standalone setup:
---
apiVersion: monitoring.coreos.com/v1
kind: ServiceMonitor
metadata:
  name: redis-standalone
  labels:
    redis-operator: "true"
    env: production
spec:
  selector:
    matchLabels:
      redis_setup_type: standalone
  endpoints:
  - port: redis-exporter
    interval: 30s
    scrapeTimeout: 10s
  namespaceSelector:
    matchNames:
    - monitoring
Grafana Dashboards
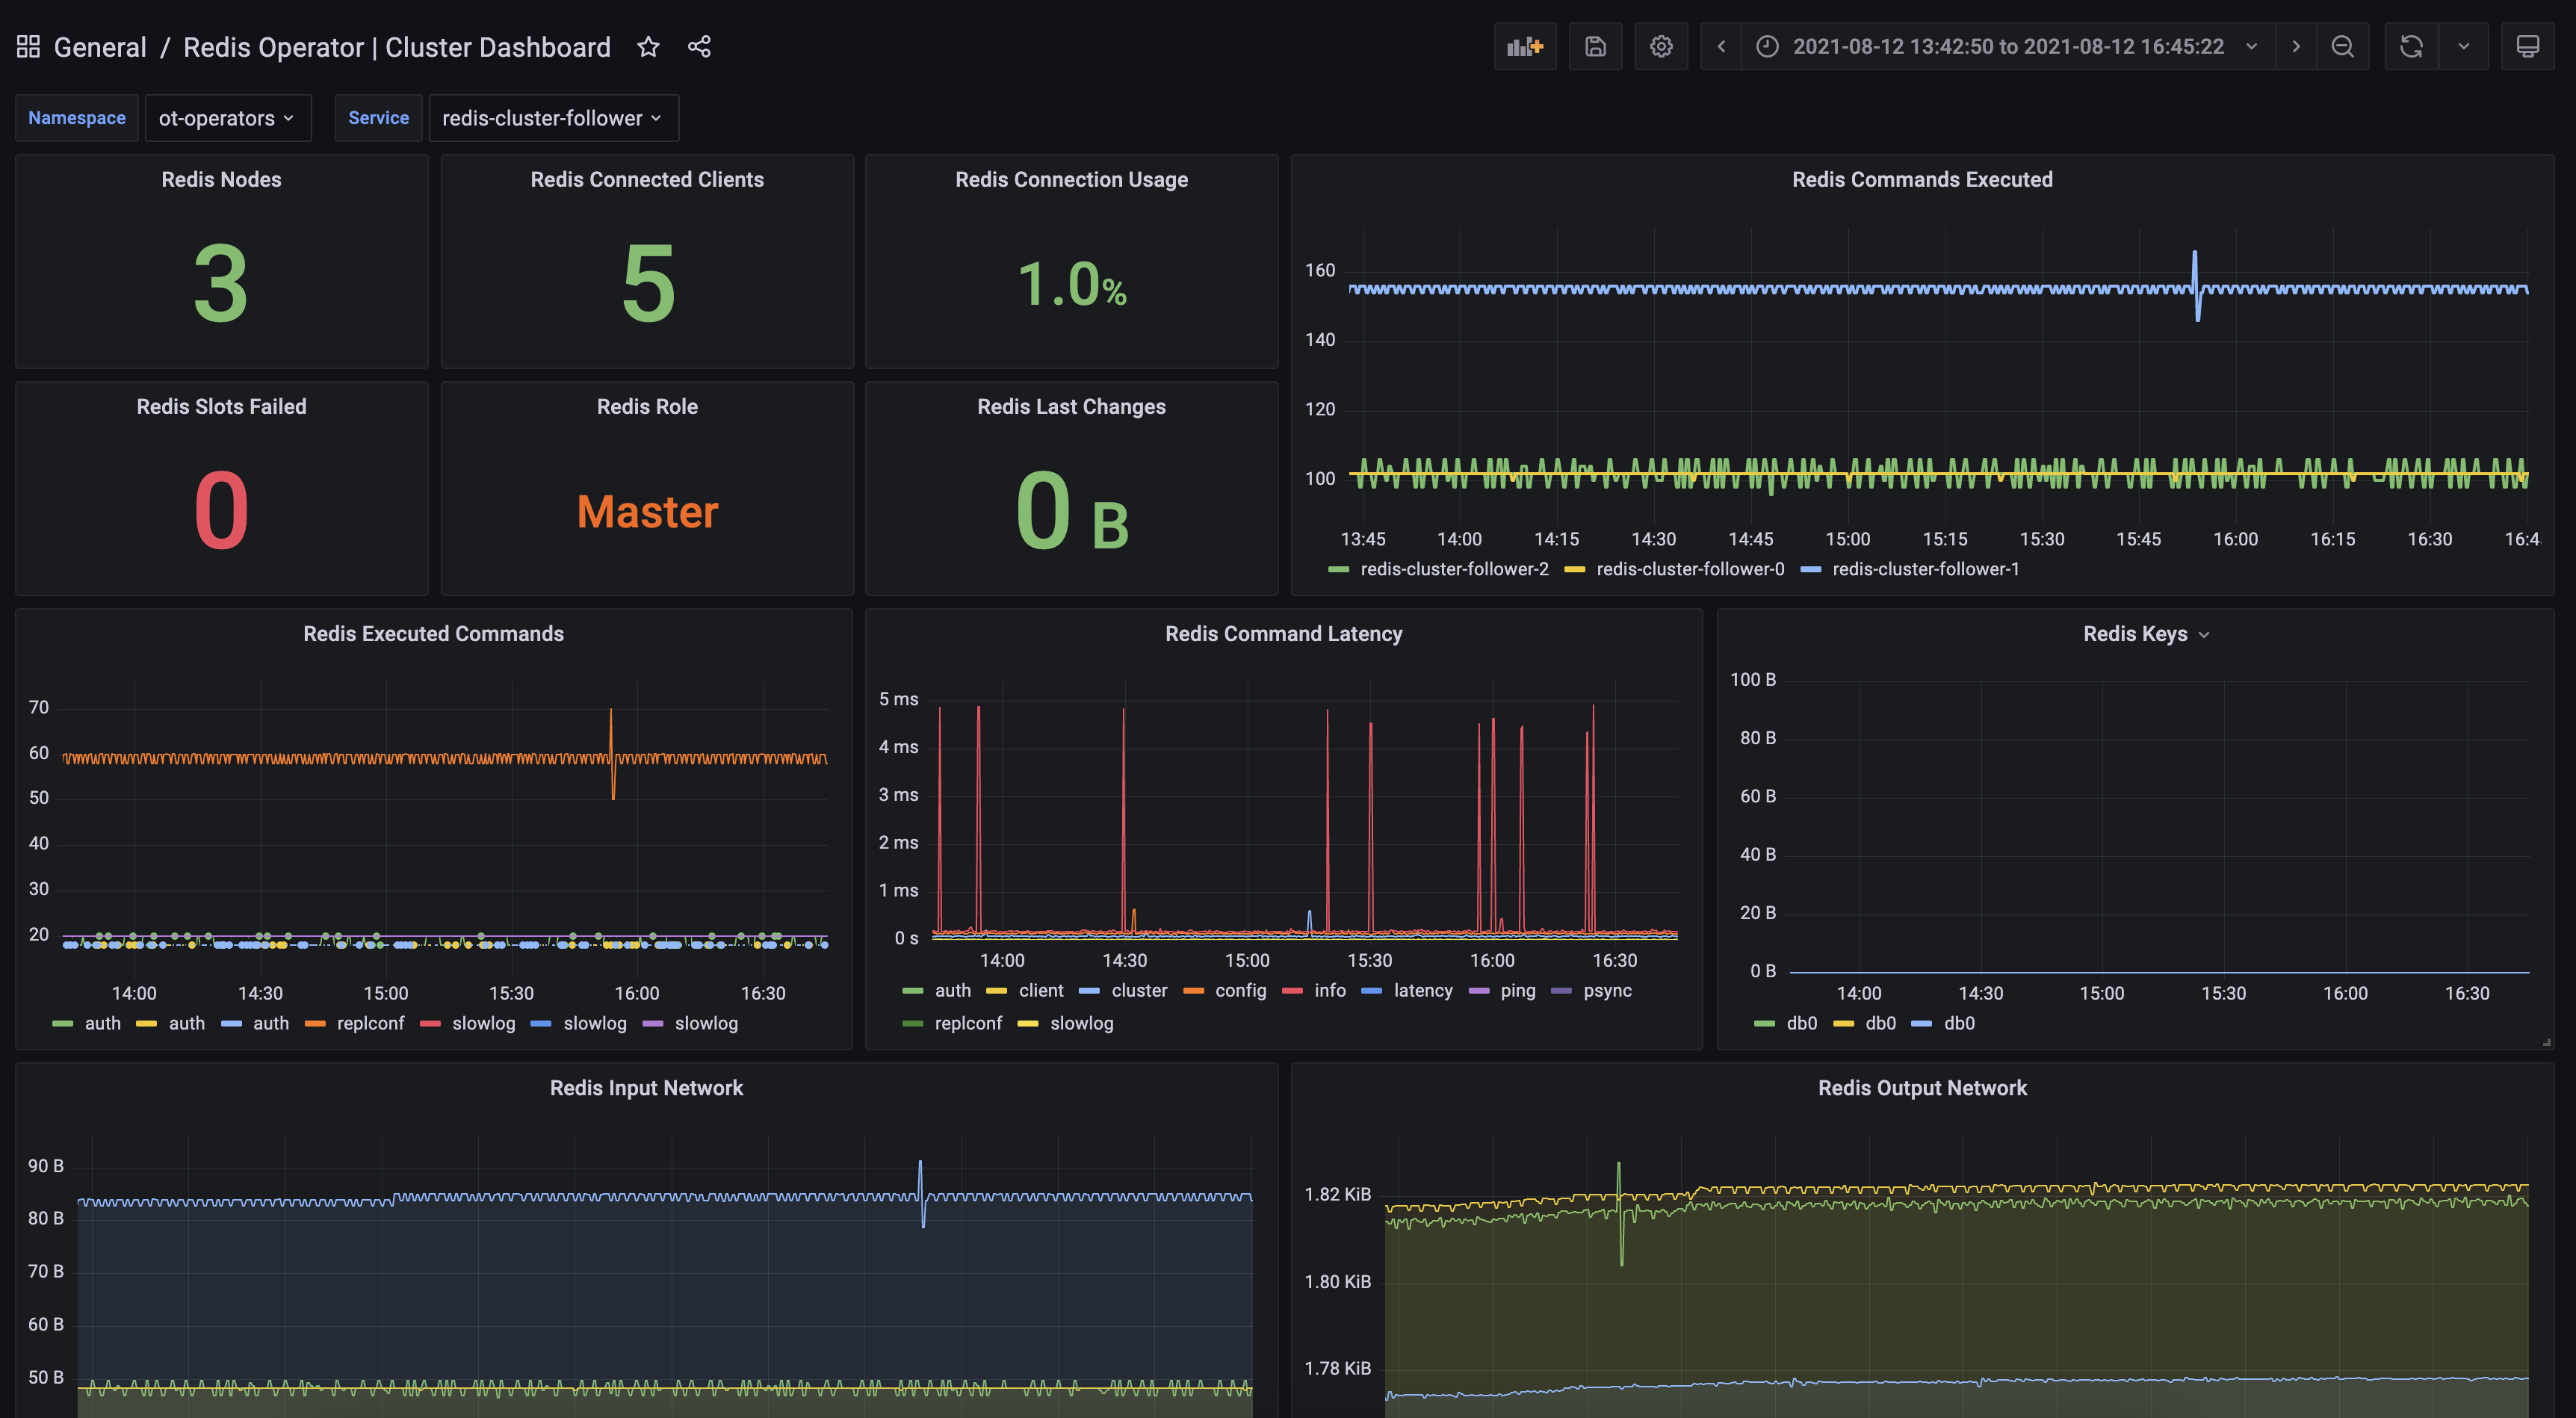
There is detailed dashboard created for Redis cluster monitoring setup. Refer to that dashboard once the metrics are available inside Prometheus setup.
Redis Operator Cluster Dashboard for Prometheus
Collecting Redis Operator Controller Metrics
The Redis Operator exposes its own controller metrics (for both RedisCluster and RedisReplication reconciliations) at the /metrics endpoint served on port 8080 directly by the operator container (plain HTTP, no kube-rbac-proxy involved).
These metrics answer questions such as:
- Is the controller healthy?
- Were any reconciliations skipped?
- How many reshard / rebalance operations have been executed?
- Do all replications have a master?
PodMonitor
If you deploy Prometheus with the Prometheus Operator, scrape the controller metrics by creating the following PodMonitor (adjust the namespace if you deploy the operator elsewhere):
apiVersion: monitoring.coreos.com/v1
kind: PodMonitor
metadata:
  name: redis-operator
  namespace: ot-operators
spec:
  namespaceSelector:
    any: true
  selector:
    matchLabels:
      name: redis-operator
  podTargetLabels:
    - name
  podMetricsEndpoints:
    - port: metrics
      path: /metrics
      scheme: http
      interval: 30s
      scrapeTimeout: 10s
If you run a self-managed Prometheus, configure a scrape-config targeting pods with name=redis-operator label on port 8080.
Grafana Dashboard
An example dashboard that visualises controller health, replica counts and operation rates is available at:
dashboards/redis-operator.json
Import this JSON file into Grafana and select your Prometheus datasource.